
TL;DR: Fieldmark Local ran 30 Ask Maps searches across Huntington, Patchogue and Riverhead. As prompts became more specific, the recommendation set changed by an average of 63.6%. When we repeated the exact prompts in a second round, the lists matched by only 61.5% on average. In this test, Ask Maps behaved like a dynamic recommendation system, not a fixed local-business list. The results do not establish ranking factors or predict what every user will see.
Google is turning Maps into a conversational discovery tool. In its August 6 Ask Maps update, Google described new capabilities for ordering food, finding hotels and events, receiving personalized answers and resuming past conversations. The company’s March introduction to Ask Maps described it as a way to ask complex, real-world questions and receive a customized map instead of manually sorting through place listings and reviews.
That creates a practical measurement problem for local service businesses. A homeowner can start with a broad request for pest control companies, then add a pest type, reputation requirement, service preference or description of what is happening inside the house. Each added detail may change which businesses are presented and how they are described.
Fieldmark Local built a two-round observational test to measure three things: how much the recommendation set changed as a prompt became more specific, how closely an identical prompt repeated in a second round, and whether the claims used to justify those recommendations were supported by public evidence.
How did Fieldmark Local test Ask Maps?
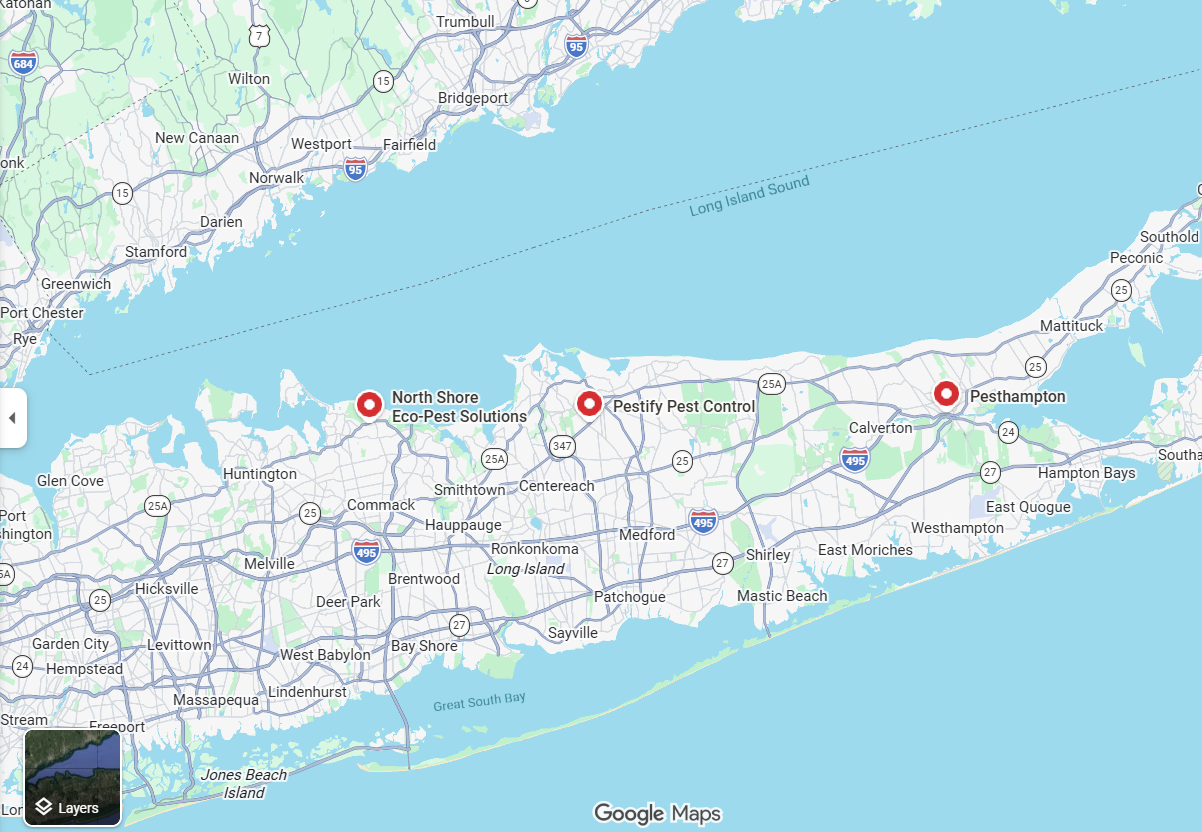
The test covered Huntington, Patchogue and Riverhead in Suffolk County, New York. All 30 searches were performed on September 6, 2026. Round 1 began at 11:00 a.m. ET, and Round 2 began at 6:00 p.m. ET. We ran 15 prompts in Round 1 and repeated the same 15 prompts in Round 2. Each town used five levels of specificity:
- Level 1: A broad request for pest control companies in the town.
- Level 2: A request for a company that handles carpenter ants.
- Level 3: Carpenter-ant service plus strong customer reviews.
- Level 4: Carpenter-ant service plus customer comments about clear communication and reliable work.
- Level 5: A natural homeowner scenario involving possible carpenter ants around a window.
Every run started in a new Ask Maps conversation. We used the same Google account, browser, device and physical location, copied each prompt exactly, and captured the full written response and screenshot before researching any recommended business. Across all 30 runs, Ask Maps returned 144 named recommendations representing 29 unique businesses.
Set change measured how many unique business names were different between a specific prompt and that town’s broad Level 1 result. Same-prompt similarity measured the businesses shared by both rounds divided by all unique businesses returned across those two runs. These measures compare membership, not the order in which businesses appeared.
After capture, we reviewed the official websites and supplied Google Maps or Business Profile links for all 29 businesses. The claim review also checked service-area support separately for each town in which a company was recommended, producing 38 business-town checks.
How much did a more specific question change the recommendations?
A great deal. Compared with each town’s broad Level 1 result, the recommendation set changed by 64.5% on average in Round 1 and 62.7% in Round 2. The combined average was 63.6%.
| Study measure | Round 1 | Round 2 | Combined |
| Completed runs | 15 | 15 | 30 |
| Named recommendations | 76 | 68 | 144 |
| Average recommendations per run | 5.1 | 4.5 | 4.8 |
| Average set change vs. Level 1 | 64.5% | 62.7% | 63.6% |
| Level 1 businesses still present at Level 5 | 43.8% | 53.8% | 48.3% |
| Level 5 newcomers vs. Level 1 | 50.0% | 56.3% | 53.3% |
| Same-prompt similarity across rounds | N/A | N/A | 61.5% |
Source: Fieldmark Local two-round Ask Maps study. Percentages are rounded to one decimal place.
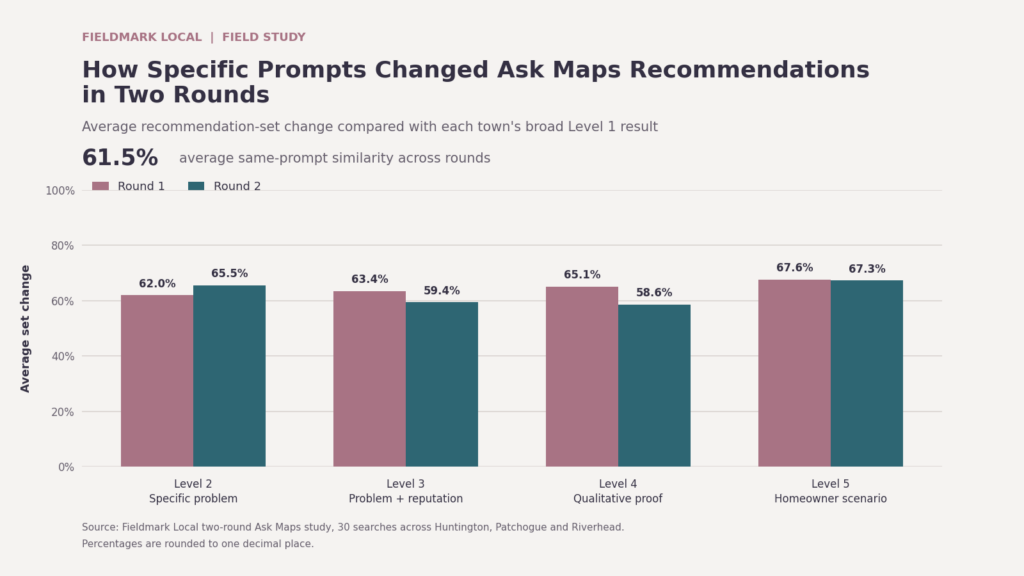
The effect was strongest in the most natural prompt. At Level 5, the average set change reached 67.6% in Round 1 and 67.3% in Round 2. Across both rounds, only 48.3% of businesses from the broad result remained in the Level 5 result. At the same time, 53.3% of Level 5 recommendations were businesses that had not appeared in that town’s broad list for that round.
A single broad query therefore provided an incomplete picture of visibility in this test. A business missing from the general list could appear when the request described a specific pest or customer concern. A company visible in the broad list could disappear as those constraints were added. The study does not identify what caused any individual change, but the shift itself repeated in both rounds.
Did Ask Maps return the same businesses when we repeated a prompt?
Only partly. Identical prompts produced 61.5% average recommendation-set similarity across the two rounds. Broad Level 1 prompts were the most stable at 74.6%. Level 4 prompts, which added qualitative requirements about communication and reliability, were the least stable at 34.4%. Level 5 homeowner scenarios reached 66.7% similarity.
The individual lists moved more than the overall candidate pool. Round 2 returned 23 unique businesses, and every one of them had appeared somewhere in Round 1. Six, however, appeared under a different test town. Four businesses were unusually durable and appeared in all ten prompts for their assigned town across both rounds.
A reasonable interpretation is that Ask Maps assembled changing lists from a substantially overlapping pool of businesses. The test cannot isolate whether a particular change came from personalization, live data, model behavior, location handling or another system input.
What kinds of claims did Ask Maps use to explain its choices?
Ask Maps did more than return company names. It supplied detailed explanations about why each business appeared suitable. When we consolidated those statements across the 29 business profiles, the most common claim categories were structural diagnosis or exclusion for 23 businesses, thoroughness or inspection for 18, carpenter-ant expertise for 18, communication or transparency for 16, and response speed for 16.
Google says Maps can analyze information about hundreds of millions of places, including community reviews, when answering questions. That helps explain why the responses often sounded specific and customer-informed. It does not tell us which source produced a particular sentence or whether any one attribute caused the recommendation. For a broader operational review, use Fieldmark Local’s Google AI visibility checklist.
How well did the recommendation claims hold up?
The business-level review produced 17 Verified profiles, seven Weakly Supported profiles and five Mixed profiles. Verified means the material recommendation claims were supported by accessible official website or Google Business Profile evidence. Weakly Supported means the core service or coverage was supported, but specific review-derived language or another detail could not be fully confirmed. Mixed means important claims were supported while another meaningful detail conflicted with, or was not established by, the available evidence.
The review found practical examples of why verification matters:
- One business was described as operating 24 hours even though its official site listed service hours of 7 a.m. to 7 p.m.
- A local operating-history claim could not be confirmed on the company’s official franchise page.
- One Google Business Profile carried the expected business title, while visible review summaries and owner responses repeatedly named another brand, making review attribution unreliable.
- Several service-area statements extended beyond the towns clearly supported by the official website.
None of the 29 profiles was classified as wholly Incorrect or Unverified. That does not mean every sentence in the 144 recommendation occurrences was correct. The classifications summarize the combined claim profile for each unique business, and several profiles contained individual statements that should not be repeated without qualification.
What should a local service business do with these findings?
1. Test more than one customer question
Run a small, repeatable set of prompts that reflects how customers actually describe the job. Include a broad category request, an important service, a reputation requirement and a natural scenario. Repeat the same prompts later. Record the account, device, location, date and exact wording so changes can be interpreted responsibly.
2. Describe real services in customer language
A page that says only ‘pest control’ gives customers little help with a carpenter-ant problem around a window. Explain the actual services offered, the situations technicians handle, inspection steps, service limitations and what happens next. Keep the language accurate and readable. Do not add services or towns simply because they appeared in a test prompt.
3. Reconcile hours, service areas and company history
Compare the website, Google Business Profile and important third-party listings. Correct conflicting hours, old brand names, unsupported service areas and inconsistent descriptions of ownership or operating history. These issues can confuse customers even when they do not affect whether Ask Maps displays the business.
4. Build evidence around important claims
Support meaningful statements with information a customer can verify: service details, licenses or credentials where relevant, clear policies, real job photos, technician explanations and authentic reviews. Ask customers for honest feedback in their own words. Do not script reviews or manufacture examples designed to echo a target prompt.
5. Treat a visibility test as evidence, not a verdict
One query can miss a business that appears under a more specific request. One successful result can also disappear in a later run. Track patterns, preserve screenshots and compare the public explanation with the facts the business can document. Avoid major site or profile changes based on a single response.
What does this study not prove?
This was a controlled observational test from one account, browser, device and physical location. New conversations were used for every prompt, but account-level history remained available. In one Round 2 response, Ask Maps explicitly indicated that two recommendations had been previously viewed or searched. The rounds should not be described as fully independent.
The study also involved one partial text capture. Its five-business set was recovered from the first written name and four map pins, but most explanations and the order after the first result were unavailable. A separate response omitted one company name from the narrative, so the business was identified from the matching map pin.
The results apply to this pest-control test in three Suffolk County towns. They do not establish a universal Ask Maps ranking system, isolate a causal input or predict what another account will receive. Ask Maps is also changing quickly, so this study should be treated as a documented snapshot that can be repeated and compared over time.
The practical takeaway
Ask Maps visibility was prompt-sensitive and only moderately repeatable in this study. A business could appear in a broad request and fall out when the homeowner added a specific need. Another business could be absent from the broad list and enter when the question described the actual problem. The accompanying explanations also carried specific claims about expertise, availability, service areas and reputation that did not always match public evidence cleanly.
Local companies should make their services, coverage and proof easy to verify, then monitor what customers are actually being shown. Fieldmark Local’s Local Visibility Leak Audit compares the business a company operates with what appears across Google, Maps, websites, reviews, listings and selected AI-search experiences. See how the audit applies to pest control companies or request an Audit Fit Check.
About the author
Andy Carr is the founder of Fieldmark Local. He has more than 25 years of experience in digital marketing, search, analytics and eCommerce, and previously operated a pest-control company for nine years. That background informed the study’s customer scenarios and its review of service, coverage and reputation claims.